 ZParen
Run and debug
ZParen keeps one SBCL running for the project. Everything on this page works in that live image, so a fix you make while the debugger is open applies to the call that failed.
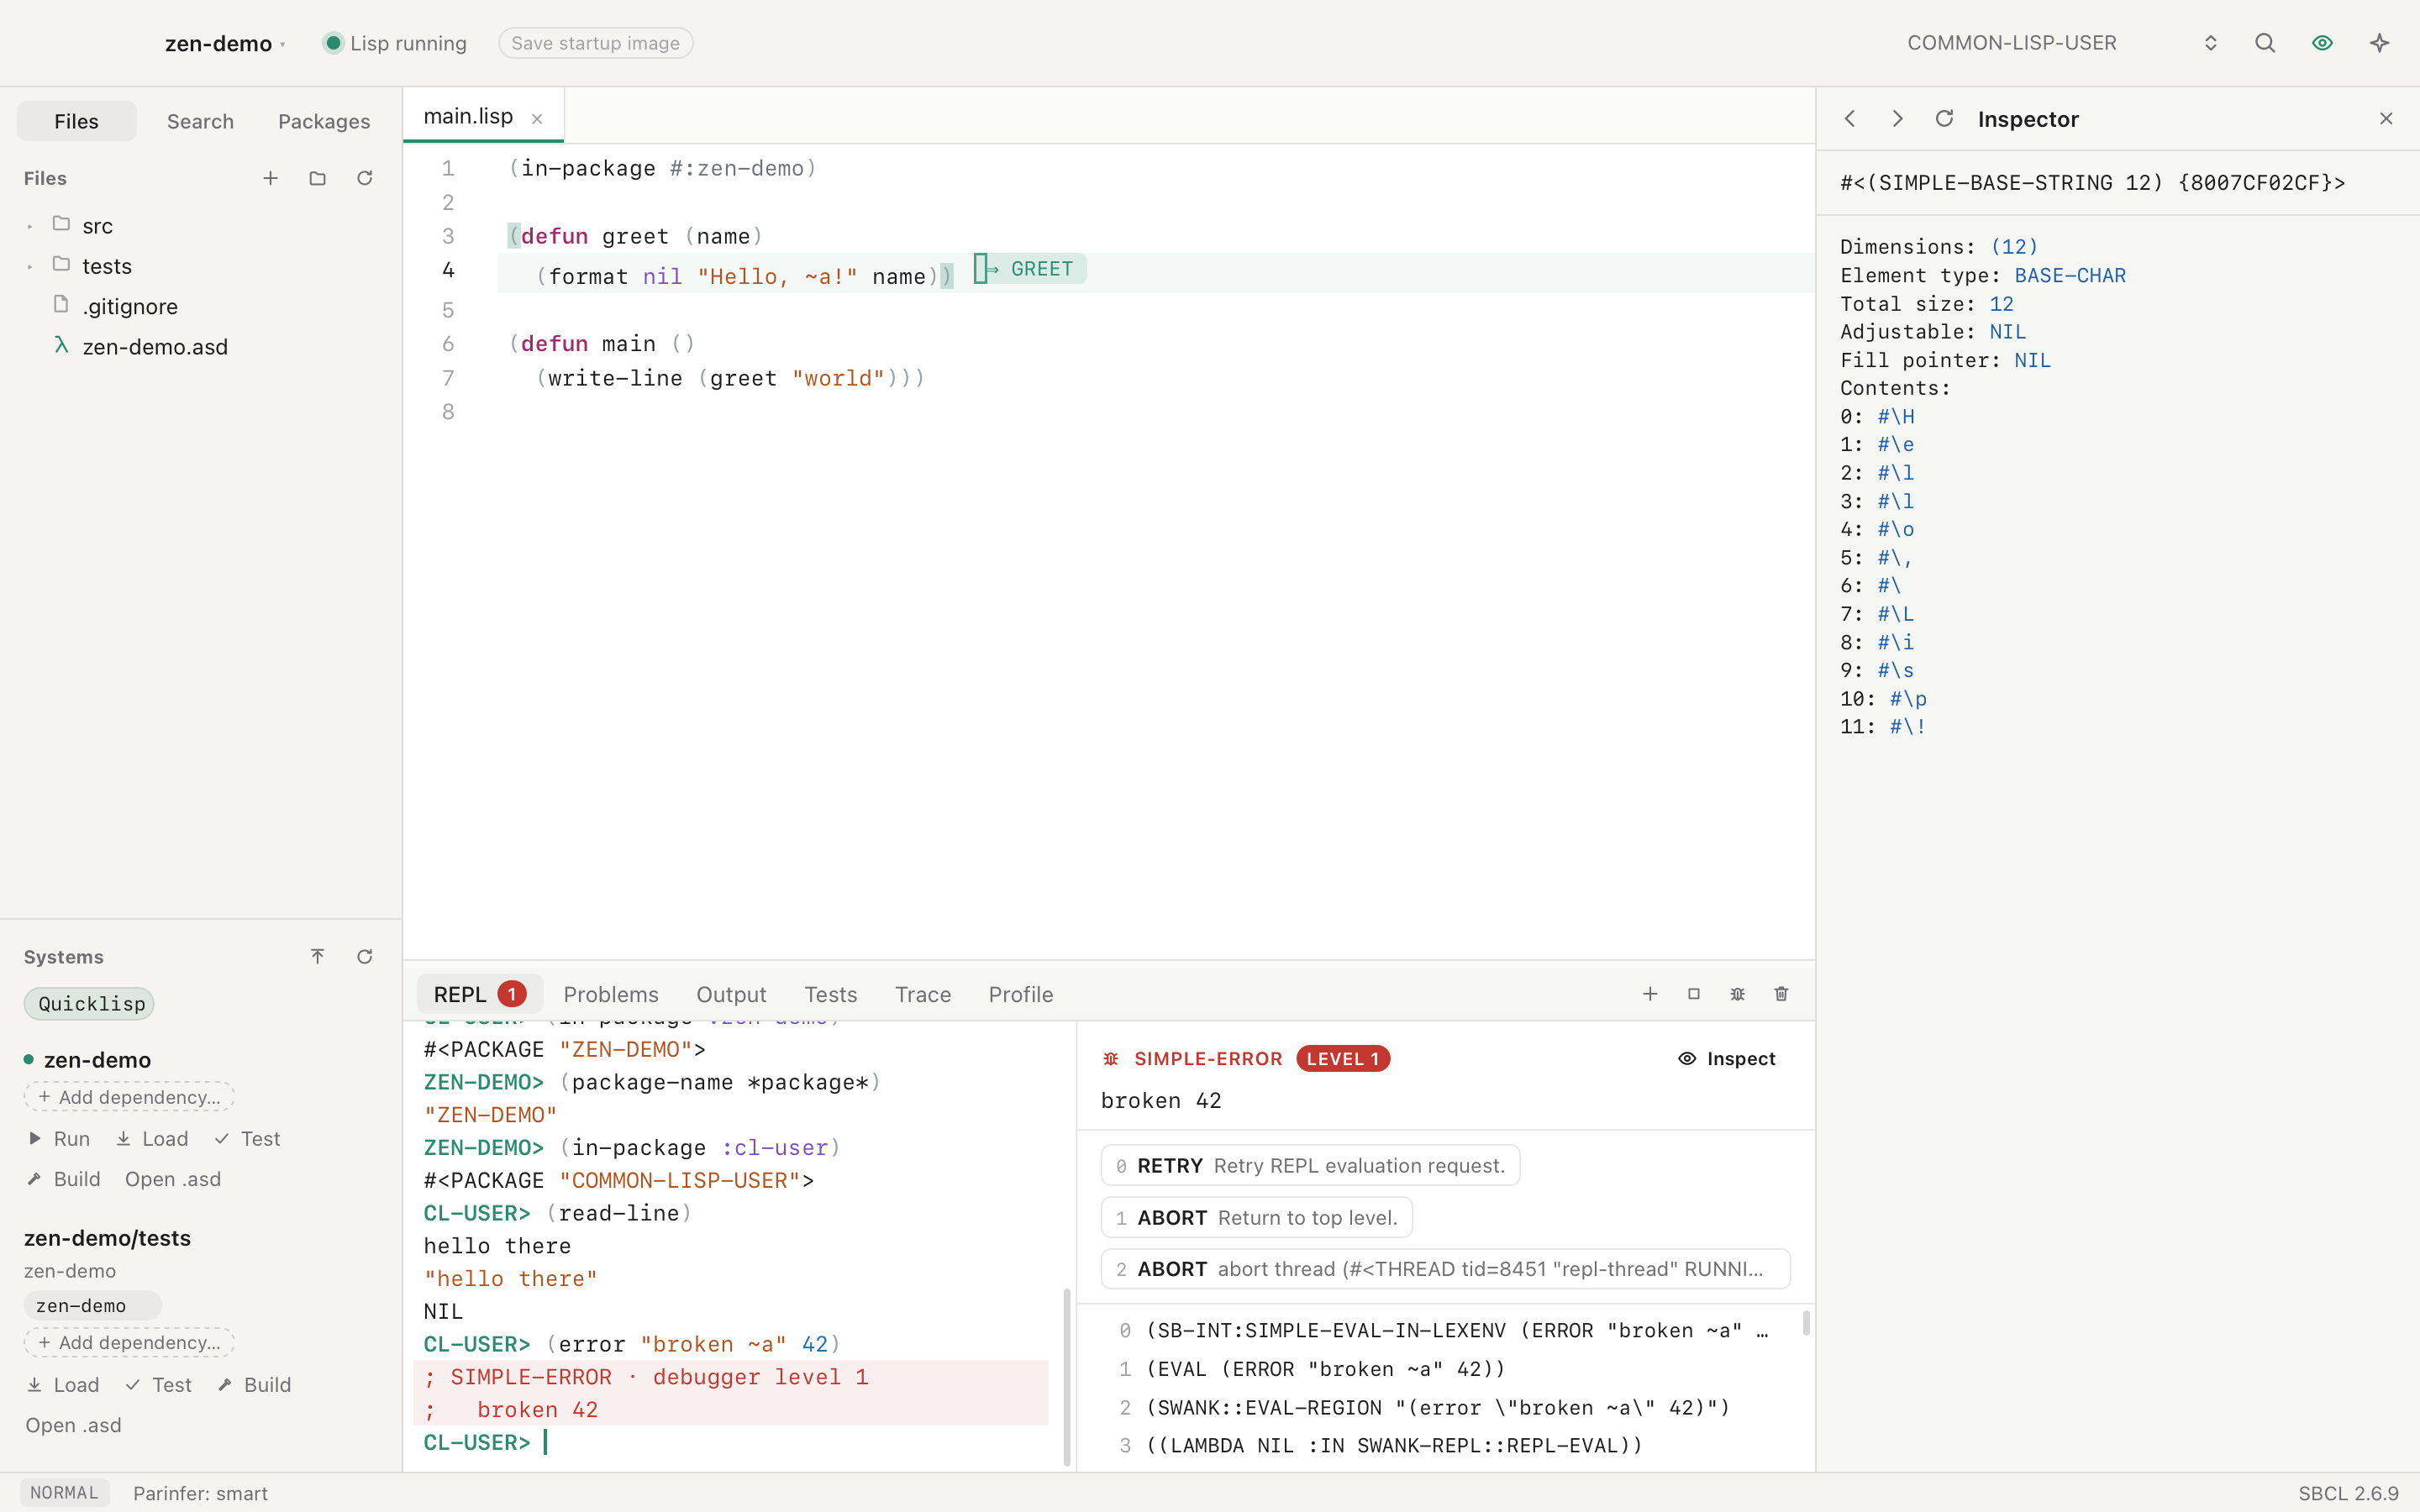
REPL and inspector #
Results are live objects. Click one to use it in the next input, or ⌘-click it to inspect it. ⌃R searches earlier input. Extra REPLs run in their own threads. ⌘J goes to the REPL, and from the REPL back to the editor.
The REPL starts in COMMON-LISP-USER. To change its package, use the
package box in the title bar, or evaluate (in-package …) in the REPL. To make
the REPL follow the file you edit, turn on Settings ▸ General ▸ REPL
package. Each time you switch to a file, the REPL then switches to the
file's in-package, when Lisp has that package. A package you choose in the
REPL holds until your next file switch.
A right-click in the REPL opens a menu for what you clicked:
- Every item: Explain and Ask Assistant About It…, as in the editor, then Clear REPL.
- An earlier input: Copy to Input.
- A result: Use in Input and Inspect Result.
- A selection: Evaluate Selection, Inspect Value, Copy, and Cut in the input.
- A symbol in an input or a result: Go to Definition, Find References, Show Documentation, Inspect and Trace Function.
The inspector opens on the right. When the right panel holds more than one view, such as the inspector and Documentation, a tab row shows at its top. Click a tab, or press ⌃Tab and ⌃⇧Tab, to go back to a view as you left it.
With Vim keys on, the REPL uses Vim too. Each prompt starts in insert mode,
so you type as before. Press Escape for normal mode. There, k and the other
motions move into the transcript, y copies from it, and edits change only
the input. Enter runs the input, or copies an earlier input down to the
prompt. ↑ and ↓ recall earlier inputs. ⌃C, ⌃R and ⌃L keep their REPL meaning
in every mode: interrupt, search history, clear. K shows a symbol's
documentation.
Debugger #
An error stops the code where it happened and opens the debugger beside the REPL. Nothing is lost: you choose how to go on.
- What went wrong comes first, in plain words: "
gretis not defined as a function", "Expected a number, but got the string"5"", "Division by zero". For a name that is not defined, Did you mean lists names that are, and a click calls or uses that one instead. Define writes a stub after the form that calls the function. - The ways to go on are buttons. Abort (q) gives up. Others retry, or go on with a value you type in the panel. Swank's own restarts wait under More.
- The backtrace shows your own frames, with file and line. SBCL's and Swank's frames fold, and a click opens them. Your innermost frame opens first, and the editor marks its form with each argument's value beside it.
- Fix and go on: change the function and compile it, or define it again at the REPL. The debugger then says which frame runs the old code, and Restart frame runs the new code from that call.
- Evaluate in this frame runs a form with the frame's values. An error in the form shows as text there, not as another debugger.
- An error while the debugger is open opens another level. The panel says so, and Back to the earlier error leaves it. The buttons offer only this level's ways to go on. Close returns every level to the top, however many errors deep you are.
- Explain asks the assistant what went wrong and how to fix it. ? explains restarts, frames and levels, with a link to the course lesson when a course is open.
- Show everything shows SBCL's own text: the whole condition, every restart and every frame. ZParen remembers the choice.
Form breakpoints and stepping stop the code where you choose.
Breakpoints #
Click the gutter left of a line to set a breakpoint on the form that starts there. Click it again to clear it. A solid dot means the breakpoint is on compiled code. A hollow dot means the code is not loaded yet, or the form makes no call to stop at.
Code stops at a breakpoint wherever it is called from in the project's Lisp: the REPL, Run in the Systems list, or the tests (⌘U). A load or a test run that loads a file again puts its breakpoints back on the new code before that code runs. The debugger opens in the REPL tab with the form and the backtrace. Into (F7), Over (F8) and Out (⇧F8) step from there, and Continue (F9) runs on. A time limit around the code, such as the 5 seconds the Lisp course gives each check, does not end the stop.
To see values, look beside the code in the editor, or at the frame in the
backtrace: its arguments and locals show there. Click a value to inspect it.
Type a form in Evaluate in this frame to run it with those variables,
for example (length name). SBCL sometimes keeps a variable under a name the
compiler made, such as #:G2 for an argument passed to format. These
compiler temporaries hide behind a link under the locals.
A breakpoint stops only the project's Lisp. A Learn Lisp Check runs in a new SBCL, so it does not stop there.
Tools #
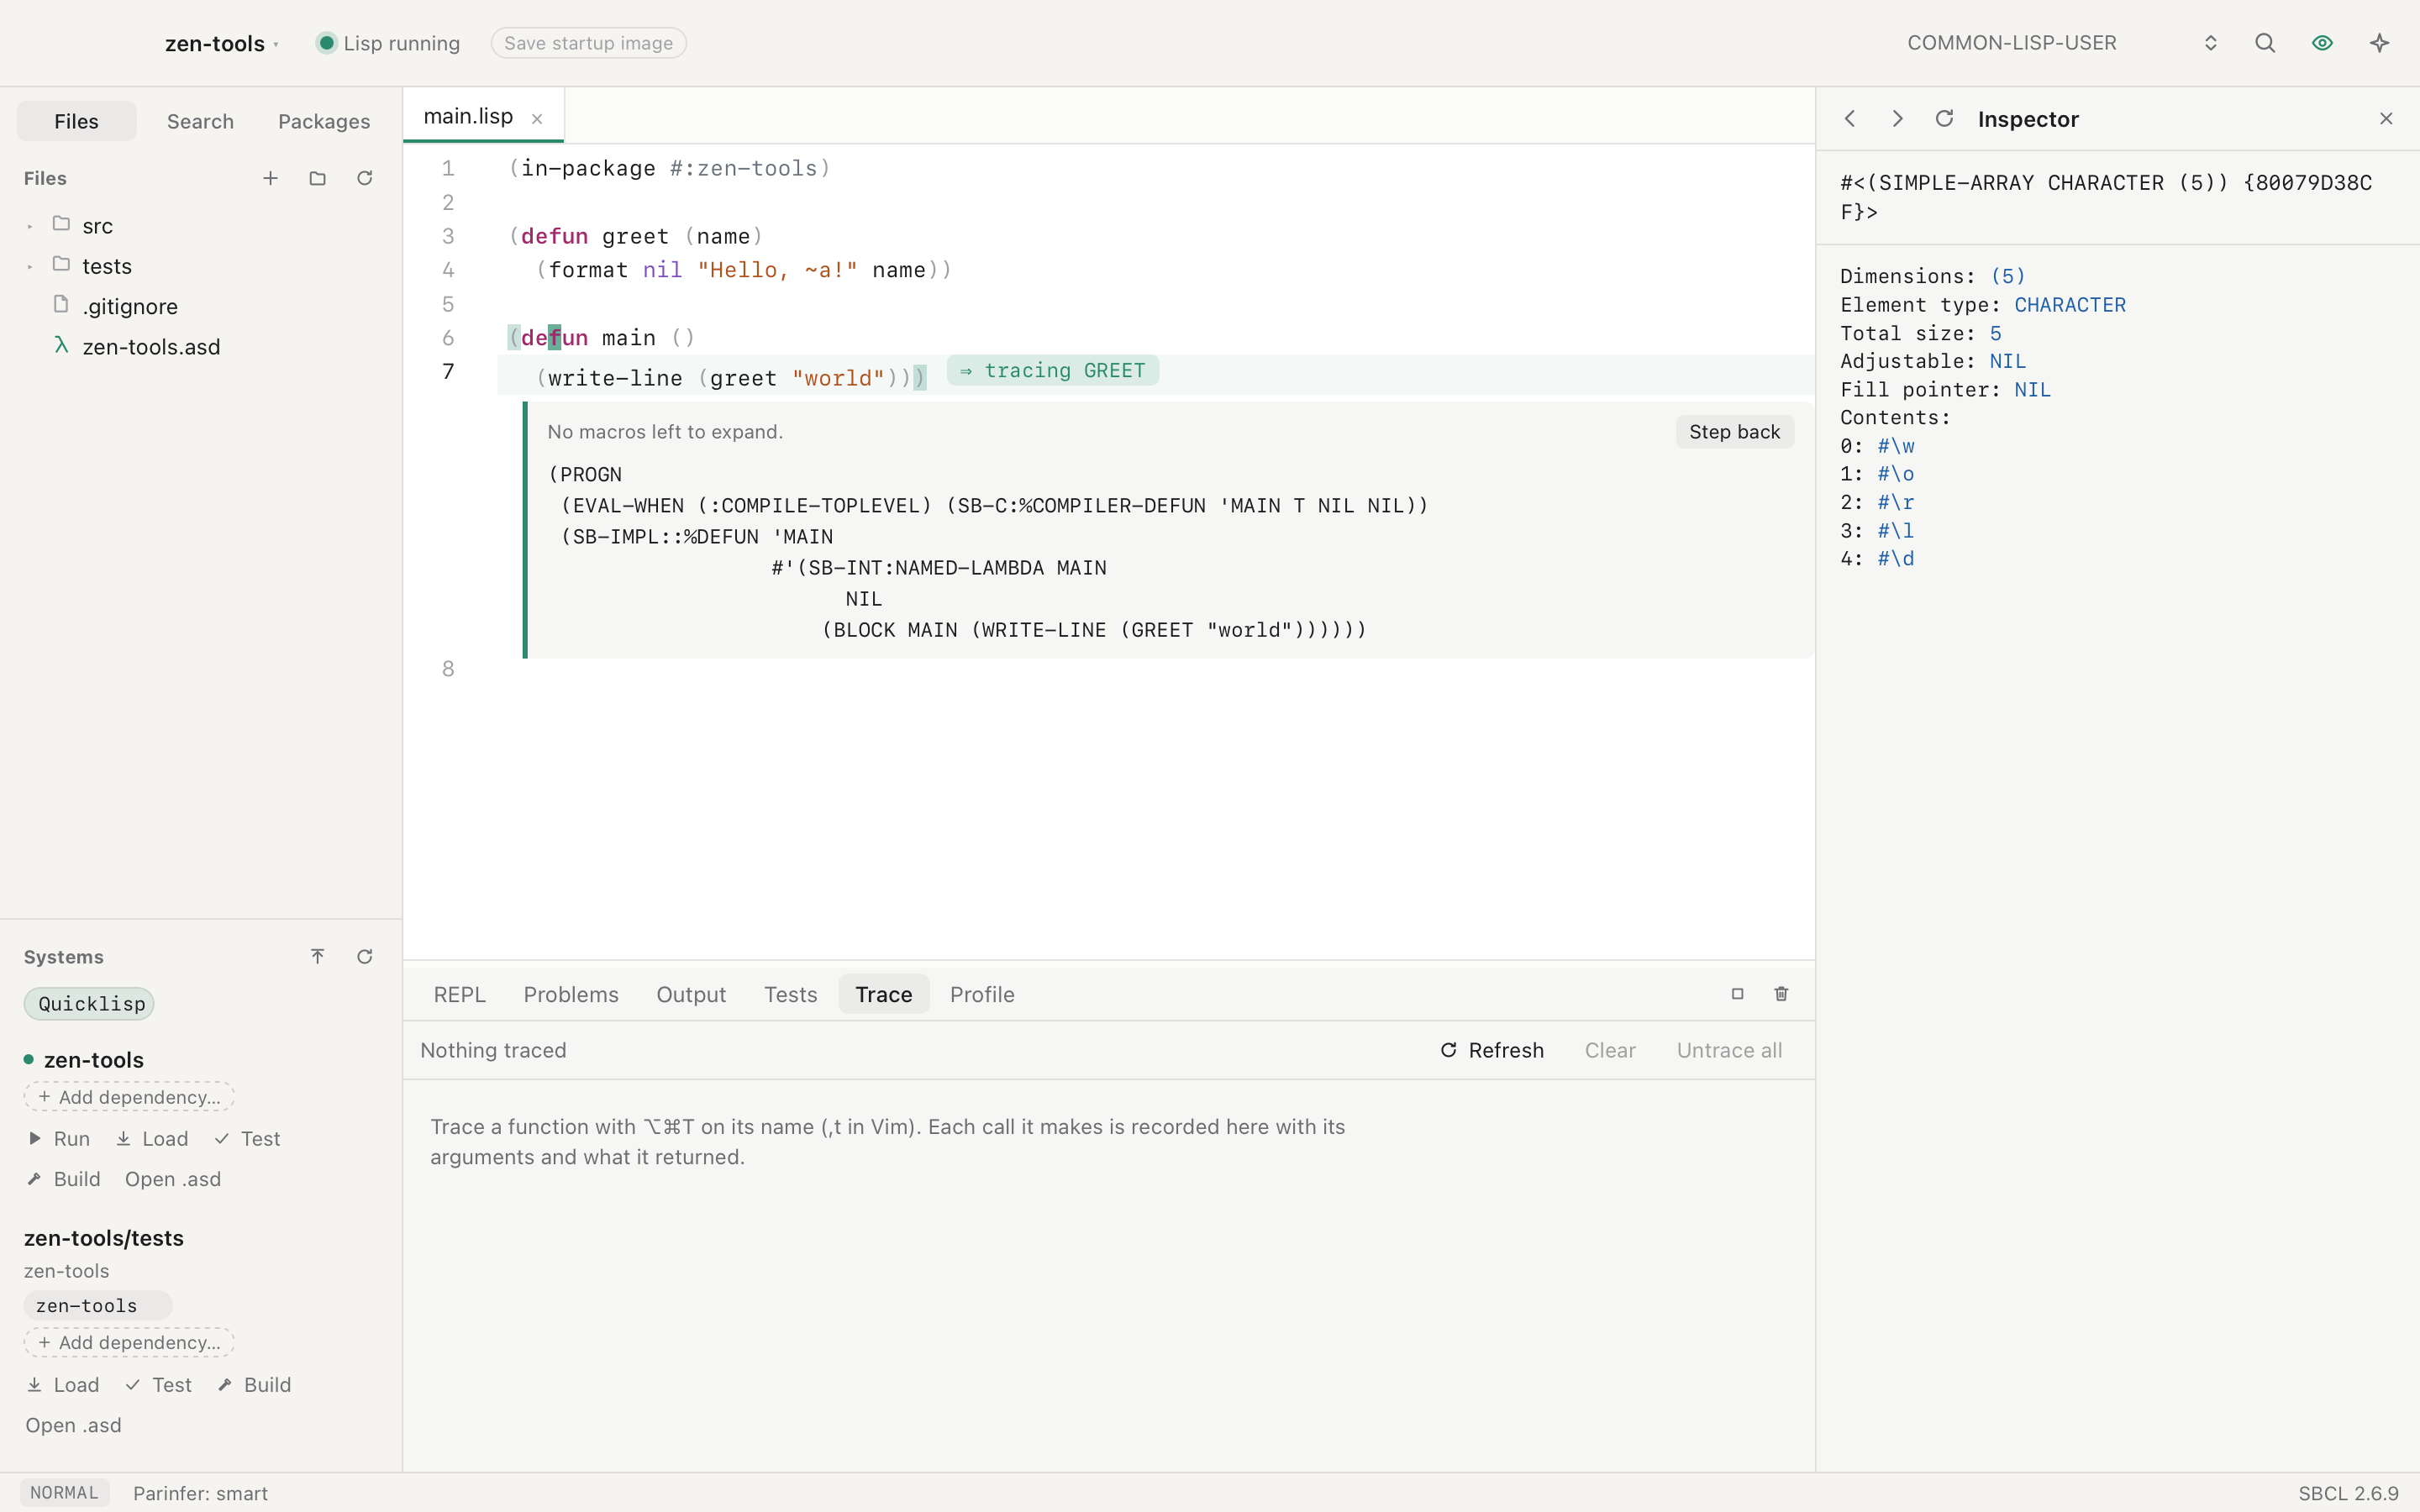
- Trace and Profile panels.
- Macroexpansion in place, under the form.
- Disassembly of a function.
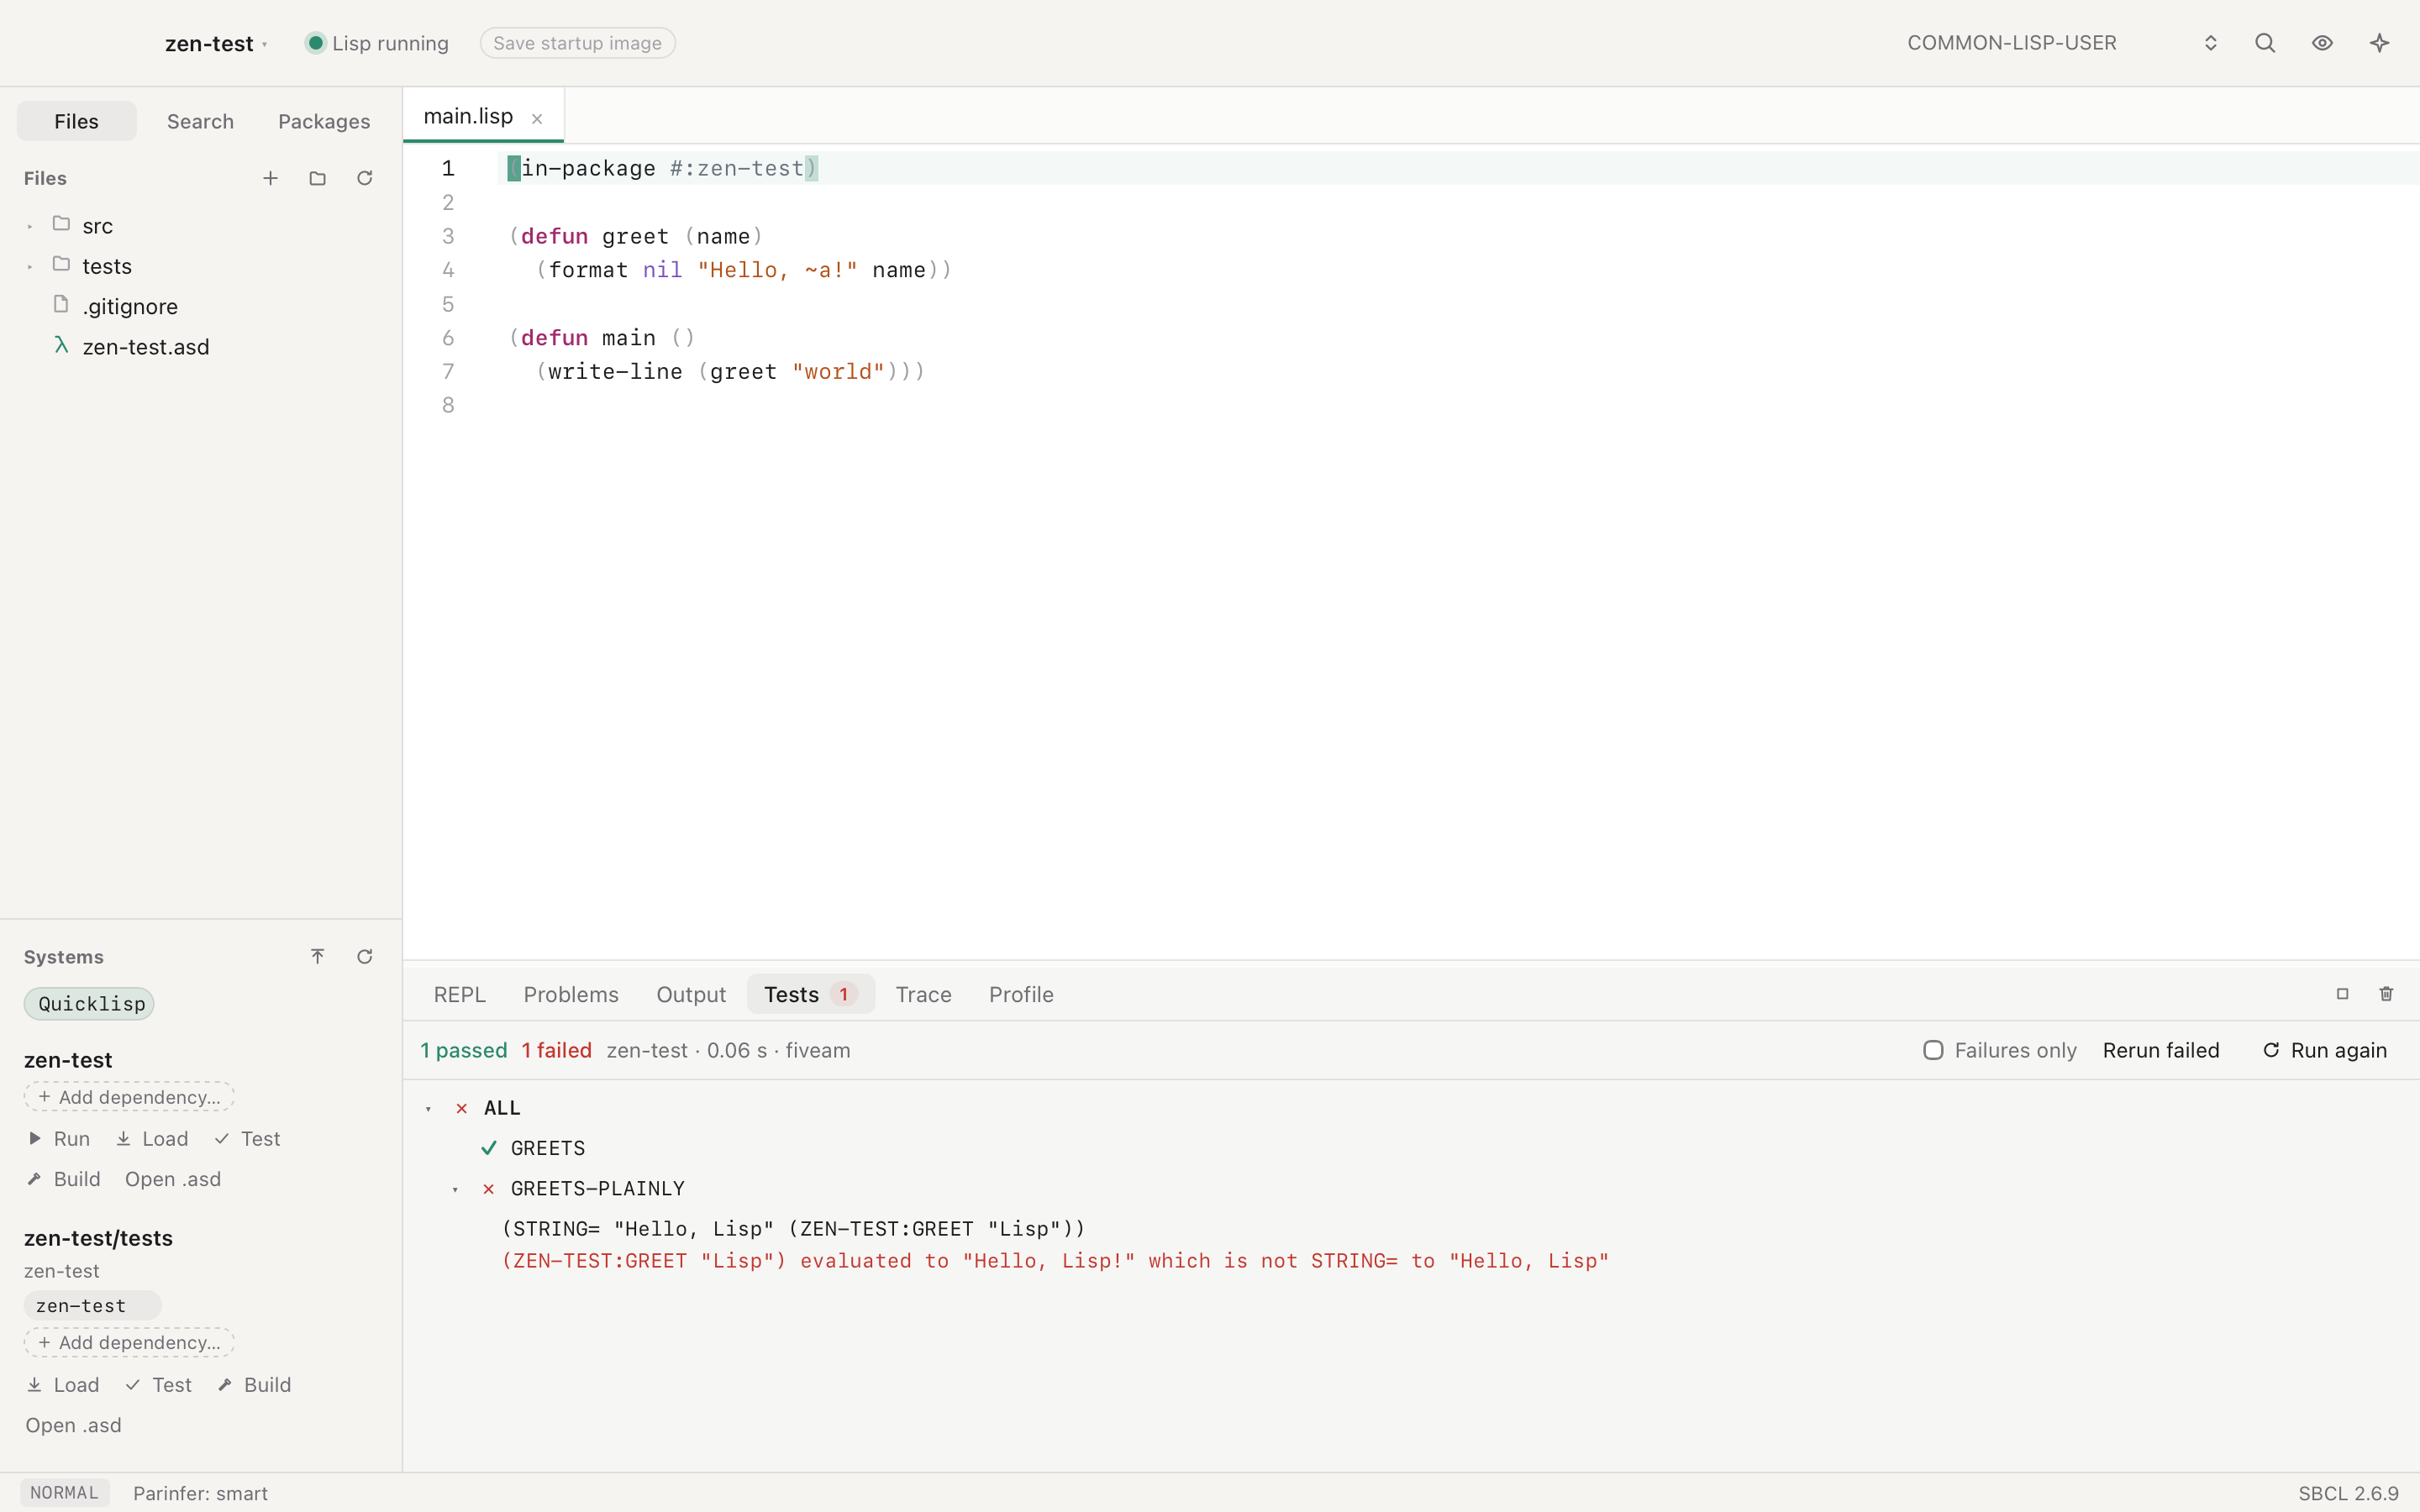
- Tests for FiveAM, Parachute and Rove, shown as a tree.
Documentation #
The Docs panel (⇧⌘D) shows argument lists, docstrings, apropos and the
HyperSpec. Hover a symbol to see its documentation, or its argument list when
it has none. In Vim, K shows a symbol's documentation in a popup.
Sessions #
A project's next session loads the systems its last one loaded. Assistant conversations are kept, listed and continued.
To start Lisp with the project's systems already loaded, save a startup image. See Projects.